Page 1 of 2
Draw Sine/Cosine wave
Posted: Thu Dec 22, 2011 8:49 pm
by xfratboy
I'm needing some help figuring out how to plot a freehand graphic in the shape of a sin/cos wave pattern. I'd need the graphic to run the width and height of the stack. Any suggestions? Thanks
edit: or maybe someone would know of an 8th grade math class that might be open for an old dumb fart like myself to audit.
Re: Draw Sine/Cosine wave
Posted: Thu Dec 22, 2011 9:59 pm
by dunbarx
Real fast, and I am sure that there are prettier and cleverer tools out there, but you did ask for the 8th grade version.
Create a curve graphic. In a button put
Code: Select all
on mouseUp
   put "150,150" into startPoint
   put 10 into amplitude --changeable
   put 2 into hScale --changeable
   repeat with y = 1 to 100
       put hScale * (item 1 of startpoint + y) & "," & trunc(sin(y) * amplitude) + item 2 of startPoint & return after sinewave
   end repeat
   set the points of grc 1 to  sinewave
end mouseUp
You can now modify and scale as you need to.
Craig Newman
Re: Draw Sine/Cosine wave
Posted: Wed Dec 28, 2011 11:56 pm
by xfratboy
Well, this is a good start. Thanks. Here's my dilemma:
- I need the wave to repeat 8~10 times
- I need the wave pattern to take up just the middle third of the stack. So, the amplitude I'm guess would be .25*(the height of this stack)
- I need the curve to be smooth.
- I need to win the lottery
Here's what I've got now:
Code: Select all
on mouseUp
   put "0,"& (.5* the height of this stack) into startPoint
   put .25*the height of this stack into amplitude --changeable
   put 5 into hScale --changeable
   repeat with y = 0 to 400
      put hscale *(item 1 of startpoint + y) & "," & trunc(sin(y) * amplitude) + item 2 of startPoint & return after sinewave
   end repeat
   set the points of grc 1 to  sinewave
end mouseUp
Re: Draw Sine/Cosine wave
Posted: Thu Dec 29, 2011 10:24 pm
by dunbarx
OK. We move to the 10th grade. The sine function in LC assumes radians. This is a bit coarser than we want, so we will convert the argument to degrees with a simple function. This will smooth out the curve. Another factor, the angular frequency "angFreq" must now be included so you have control over the number of cycles displayed:
Code: Select all
on mouseUp
      put "0,"& (.5* the height of this stack) into startPoint
      put .25*the height of this stack into amplitude --changeable
   put 3 into angFreq --changeable
      put 1 into hScale --changeable
      repeat with y = 0 to 400
            put hscale *(item 1 of startpoint + y) & "," & trunc(sin(toDegrees(angFreq * y)) * amplitude) + item 2 of startPoint & return after sinewave
      end repeat
      set the points of grc 1 to  sinewave
end mouseUp

function toDegrees radians
    return sin(radians * pi / 180)
  end toDegrees
Change the value of "angFreq" as needed and you should be good to go.
Craig Newman
Re: Draw Sine/Cosine wave
Posted: Fri Dec 30, 2011 4:30 am
by xfratboy
Thanks Craig. I think I'm missing something? When I build this it just has a blank stack (no graphic is drawn). When I check the points of the grc it shows:
5,1
5,3
5,5
5,7
etc...
What I've figured out, is that If I set the width and height of the stack to 430 & 367 respectively it seems to reproduce the problem. However, if I randomly resize the stack a few times and try again, it will eventually draw the graphic. Yet, if I set it back to width = 430 height = 367 then it stops working again.
see attached..
- sine.zip
- (1.21 KiB) Downloaded 385 times
Re: Draw Sine/Cosine wave
Posted: Fri Dec 30, 2011 8:01 pm
by dunbarx
Just lack of thorough testing. The "points" have to be integers. When you set the value of your "startPoint", you sometimes get a value with a decimal component.
Change line 2 to:
put "0,"& trunc((.5* the height of this stack)) into startPoint
That is why some stack heights work and some do not. The halfway point is an integer only now and then.
Craig Newman
Re: Draw Sine/Cosine wave
Posted: Mon Jan 02, 2012 8:03 pm
by xfratboy
Awesome! Thanks! That works. Can we move to 11th grade now? How would I determine the center point of the "peaks" and "valleys" of the curve. If I could determine those coordinates, I'd like to then put a line or dot at those points like in this picture (attached). When I loop through the points of the curve I can get the highs and lows but there may be 2 or 3 points on the same y-axis. Can you help me think of a way to pinpoint the specific coordinate for each of the peaks and valleys? Hope this makes sense.
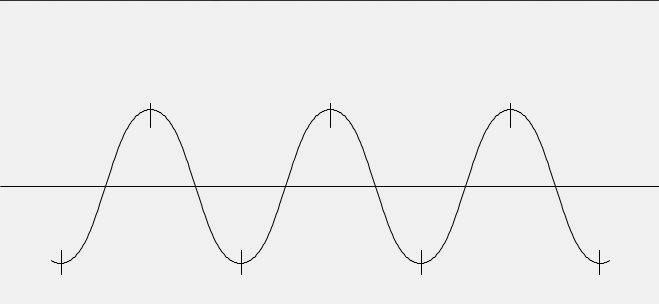
- curve.jpg (10.54 KiB) Viewed 14575 times
Re: Draw Sine/Cosine wave
Posted: Mon Jan 02, 2012 11:32 pm
by dunbarx
Hi.
Read up on the "average" function, the "max" function and the "min" function. You already have your data points. Time to think like a ninth grader.
Craig Newman
Re: Draw Sine/Cosine wave
Posted: Tue Jan 03, 2012 5:36 am
by xfratboy
I'm pretty sure I understand the min,max, and avg functions. However, these only give me the min, max, and avg for the the entire curve graphic. I'm perplexed.
Code: Select all
repeat with i = 1 to the number of lines of points in grc Curve1
put item 2 of line i of the points of grc Curve1 & Comma after templist

end repeat

answer "Minimum:"min(templist) & "Maximum:"& max(templist)
Re: Draw Sine/Cosine wave
Posted: Tue Jan 03, 2012 3:18 pm
by dunbarx
Is this not what you need? The min and max give you the peaks, and the average would give you the baseline. No?
Craig Newman
Re: Draw Sine/Cosine wave
Posted: Tue Jan 03, 2012 10:08 pm
by xfratboy
I don't think this would give me what I want. I guess I'm not making sense. I'm trying to get the coordinates for each peak and each valley in the curve.
Re: Draw Sine/Cosine wave
Posted: Tue Jan 03, 2012 11:35 pm
by dunbarx
But in a simple sine wave, all the peaks and all the valleys have the same value:
f(x) = A sin(kx-c)
A is the amplitude, proportional to the trigonometric, and has a fixed value. You can sort of see this with the curves you are getting, no? You would have to be dealing with much more complex waves, or mixtures of waves, to see different peak values.
Still not what you had in mind?
Craig Newman
Re: Draw Sine/Cosine wave
Posted: Wed Jan 04, 2012 10:04 pm
by dunbarx
Oh.
Did you mean the x,y coordinates of EACH peak and valley? Right, that is exactly what you said.
If you place all the points, which are comma separated pairs of numbers, you can see all the min and max values as they relate to the x values. You can also get the average, and find all those values as well in the list (or at least the value that comes closest). Are you able to write a script that extracts these? I can think of several ways to do it. Check out the "filter" command. Can you sort with aplomb? Write back if you are stumped.
Craig Newman
Re: Draw Sine/Cosine wave
Posted: Thu Jan 05, 2012 6:14 am
by xfratboy
Yes, that's right. The x,y for each peak and valley. I'm sure there's some way to do this but I'm not coming up with an easy solution. I'm not sure I understand your question: "Can you sort with aplomb?"
Re: Draw Sine/Cosine wave
Posted: Thu Jan 05, 2012 2:33 pm
by dunbarx
You have all your data in the variable "sineWave" as a list of ordered pairs "x,y". Sort this list by item 2 of each. Looking at the y values, this will give you all your minimum ordered pairs in the beginning of the list, which are your valleys, and all your maximum ordered pairs at the end, which are your peaks. You already have the y value of the baseLine, which is item 2 of startPoint.
Can you script this with aplomb?
Craig Newman